- Bitcoin remains around $85,600 on Monday following a 4.25% increase last week.
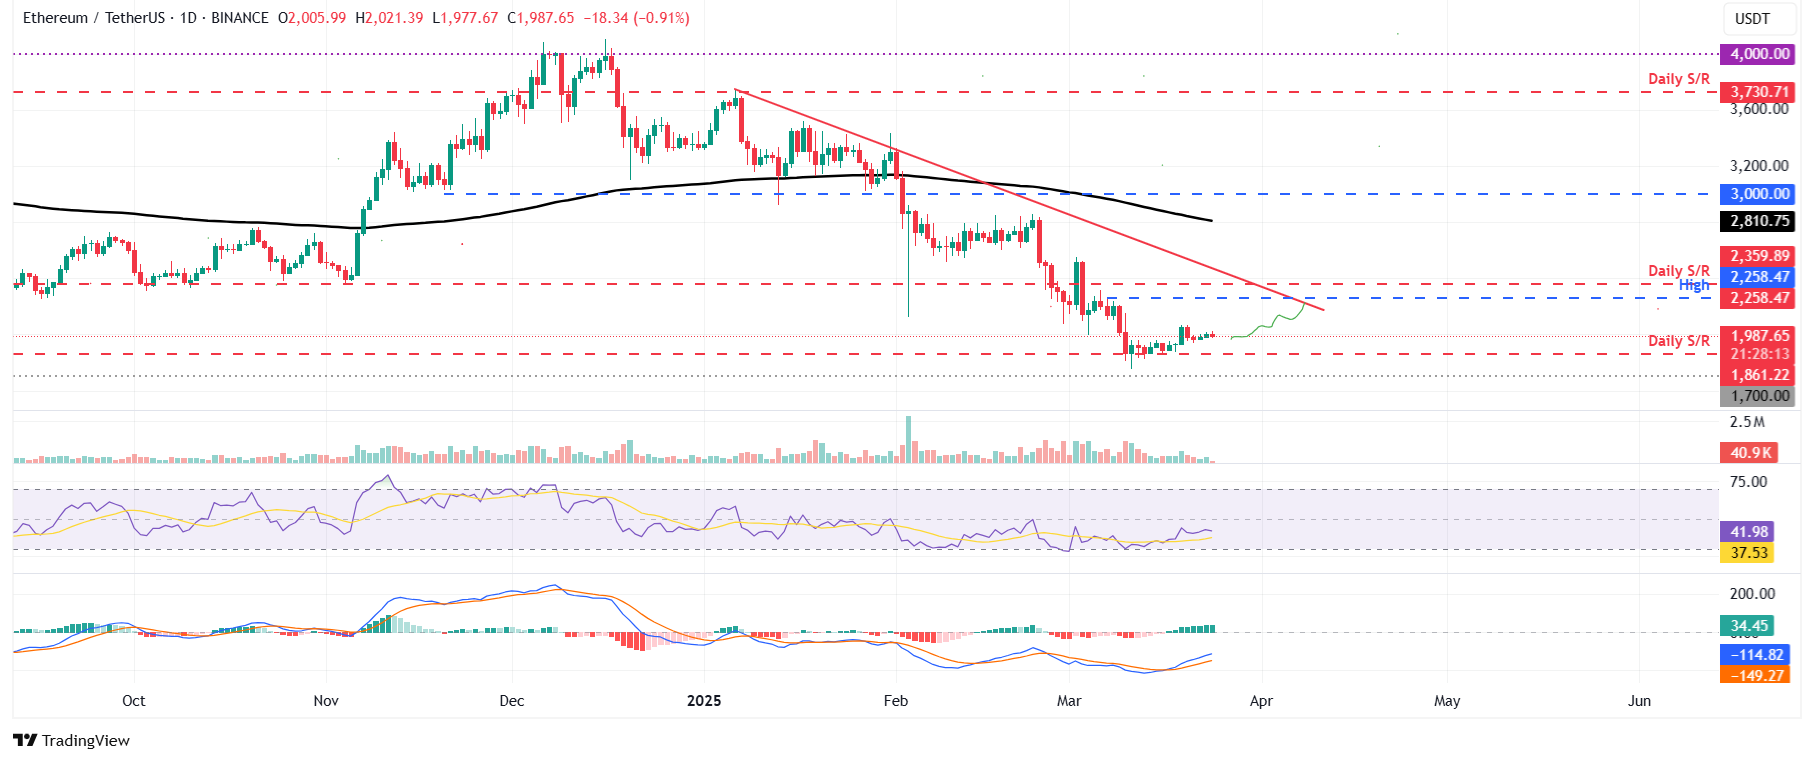
- Ethereum is finding support near the $1,861 mark, indicating a potential recovery.
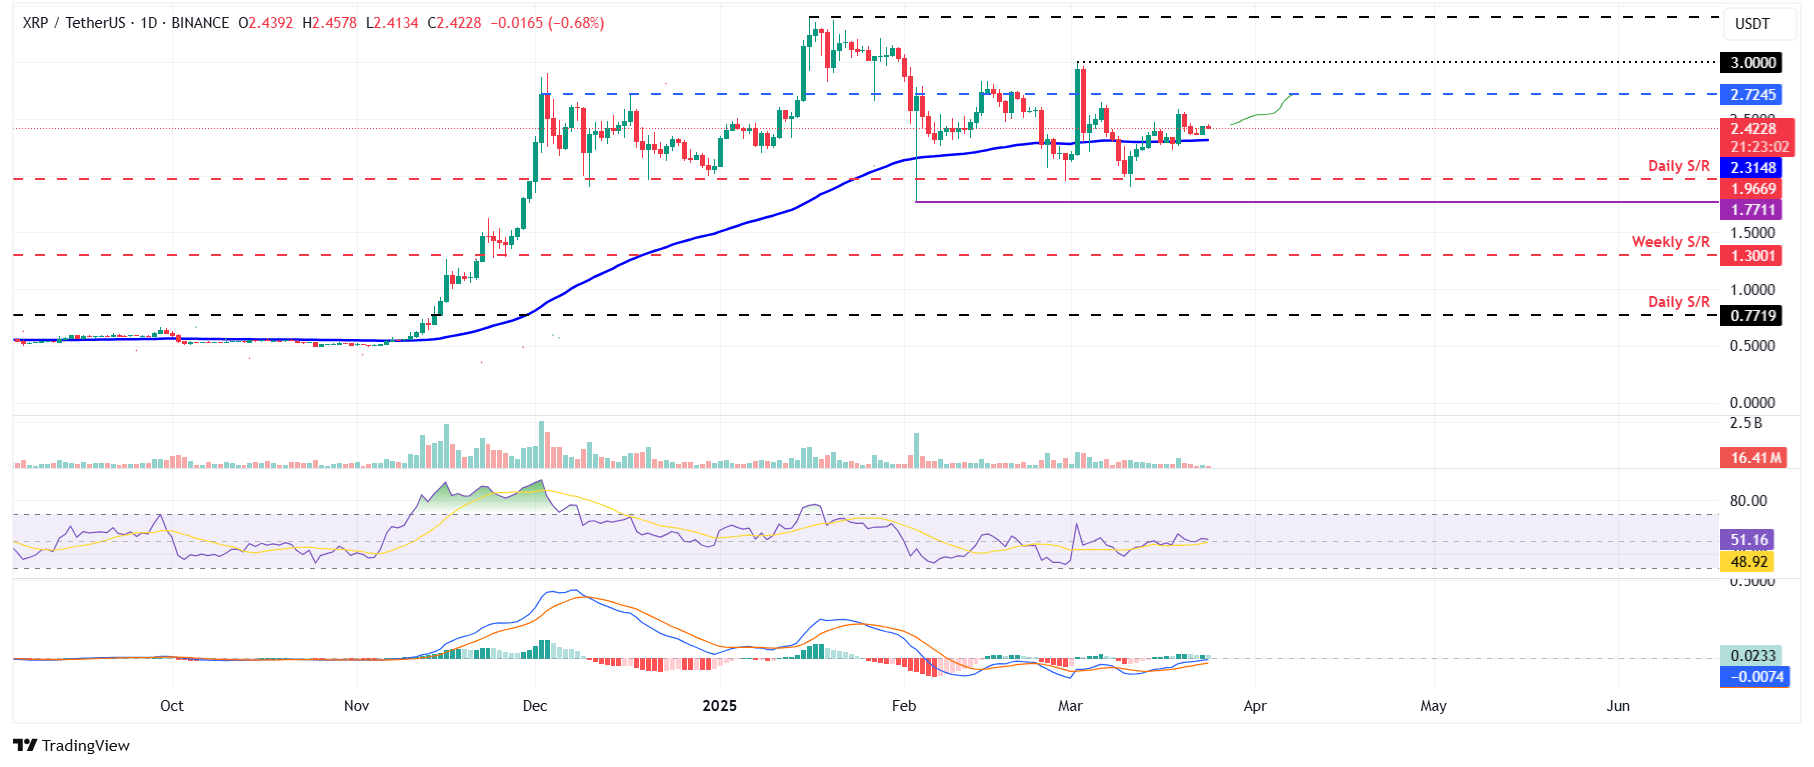
- XRP is trading at approximately $2.41 on Monday after a nearly 7% recovery last week.
On Monday, Bitcoin (BTC) is stable at $85,600 after a recovery of 4.25% last week. Meanwhile, Ethereum (ETH) and Ripple (XRP) have also mirrored BTC’s performance, maintaining their key levels after both experienced nearly 7% increases in the prior week.
Bitcoin Bulls Target $90,000
Last week, Bitcoin surpassed and closed above its 200-day Exponential Moving Average (EMA) around $85,502 but struggled to sustain support at that level. On Sunday, it reclaimed this 200-day EMA again. As of Monday’s report, it’s holding steady at approximately $85,600.
If Bitcoin can establish support at its 200-day EMA, it may continue its climb towards the significant psychological barrier of $90,000. The Relative Strength Index (RSI) is currently at 48 and trends upward, moving closer to the neutral term of 50, which signifies decreasing bearish momentum. To maintain this recovery, the RSI needs to surpass the neutral level of 50. Additionally, the Moving Average Convergence Divergence (MACD) indicator had a bullish crossover last week, suggesting a positive trend ahead.
BTC/USDT daily chart
Conversely, if BTC cannot secure support around its 200-day EMA and dips below $85,000, it risks further decline towards its next support level at $78,258.
Ethereum’s Recovery Potential If $1,861 Holds
Ethereum’s price is consolidating around $1,861, where it has found support over the past two weeks, and it has also benefited from a nearly 7% rise last week, currently sitting at roughly $1,980.
Should the $1,861 support level continue to hold, ETH’s price could extend its upward movement towards retesting its March 7 peak of $2,258. The RSI is at 40 and nearing its neutral level of 50, reflecting diminishing bearish pressure. For a sustained recovery, the RSI needs to ascend above this neutral level. The MACD indicator also indicated a bullish crossover last week, hinting at a positive trend ahead.

ETH/USDT daily chart
If ETH fails to remain above the $1,861 level and closes below it, there could be a decline towards the next support area at $1,700.
Ripple’s Potential for Recovery If 100-Day EMA is Sustained
Ripple managed to break above its 100-day EMA at $2.31 last week, experiencing a recovery of nearly 7%. It is currently hovering around $2.42.
If the 100-day EMA remains supportive at around $2.42, Ripple may extend its recovery to challenge its next resistance level at $2.72. The RSI indicates 51, hovering near the neutral position of 50, which signifies uncertainty among traders. For the bullish momentum to remain, the RSI needs to trend upward and surpass the neutral zone. The MACD indicator provided a bullish crossover signal last week, implying a favorable trend may be forming.

XRP/USDT daily chart
However, if XRP cannot maintain support around the 100-day EMA and closes below this level, it could face a further decline toward its next support point at $1.96.


