


Ethereum is currently trading above $3,200 as bulls strive to push the price toward higher resistance levels, but the overall market sentiment remains unstable. Ongoing fear and uncertainty dominate as various analysts caution that the broader trend may still lean towards a potential bear market. However, amid this volatile price action, crucial on-chain data suggests a development that could impact Ethereum’s next significant phase.
Related Reading
According to a recent report by CryptoQuant, a historic signal concerning the realized price of whales holding over 100,000 ETH has resurfaced. This metric, which tracks the average cost of the largest holders, has been tested only a few times in the past five years.
Each occurrence has coincided with pivotal turning points in Ethereum’s macro trend. Historically, whenever ETH approached or was near this realized price, it either indicated the exhaustion of a substantial downtrend or the onset of a vigorous recovery phase.
Currently, Ethereum is hovering around this critical price level again. As analysts remain split and sentiment continues to dwindle, the whale realized price has emerged as a vital indicator to watch. The next move for ETH, whether it rebounds or breaks down, could set the trajectory for the upcoming major trend cycle.
Whale Realized Price as a Cycle-Defining Threshold
The CryptoQuant report emphasizes the importance of Ethereum’s closeness to the realized price of whales with at least 100,000 ETH. The analysis reveals that ETH has only traded close to this level four times over the last five years.
Two of these instances occurred during the capitulation phase of the 2022 bear market when selling pressure was at its peak, testing long-term confidence. The remaining two instances occurred this year, indicating how unique and cycle-defining the current situation has become.
What makes this metric particularly valuable is its historical reliability. In the past five years, Ethereum has never traded below the realized price of these large holders. This level has consistently served as a structural floor, denoting price points where significant holders refuse to sell at a loss. Their actions often signal moments of deep undervaluation or macro exhaustion in the market.
Related Reading
Ethereum Attempts Recovery but Faces Major Overhead Barriers
Analyzing Ethereum’s daily chart reveals an ongoing recovery effort, though significant structural resistance still looms. Following a rebound from below the $2,900 level, ETH has regained the $3,200 mark and is currently trading around $3,238. While this bounce signals short-term strength, the overarching trend appears fragile.
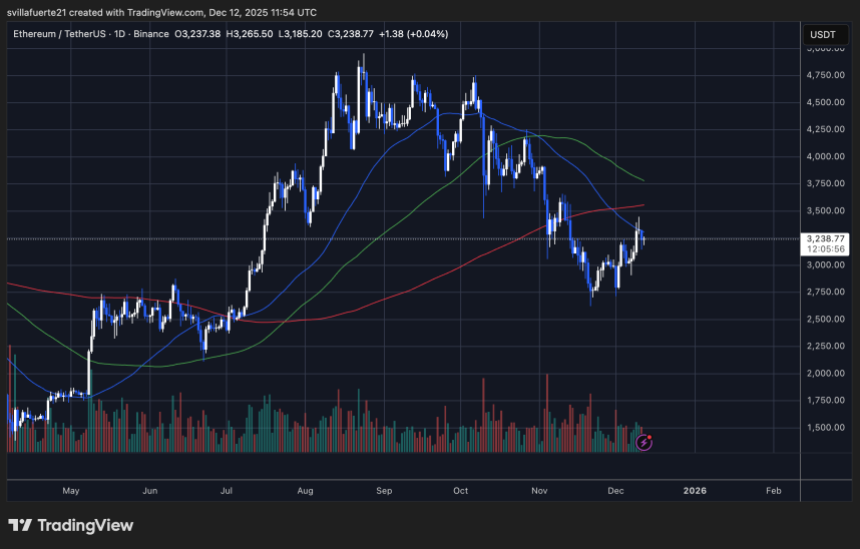
The price is currently confronting the 50-day moving average, which has acted as dynamic resistance since the decline from September’s peak. Although ETH temporarily surpassed this average, a solid close hasn’t been achieved, indicating buyer hesitation.
The 100-day and 200-day moving averages remain significantly above the current price, emphasizing that Ethereum is still functioning below major trend markers. These moving averages are expected to form a cluster of resistance between $3,400 and $3,600, a zone where sellers have previously overwhelmed bullish attempts.
Structurally, ETH appears to be forming a higher low but has yet to generate a higher high—an essential criterion to confirm a trend reversal. A clear breakout above $3,350 would enhance bullish momentum, while dropping below $3,150 could reopen the path toward $3,000 and deeper support levels.
Featured image from ChatGPT, chart from TradingView.com